Why This Popular Evolution Chart Gets Human Origins Completely Wrong
As a researcher who applies artificial intelligence to population genetics, I can tell you that when machine learning analyses human genetic data without preset evolutionary assumptions, it reveals something this chart fundamentally misrepresents: human diversity emerges from ancient networks, not linear progression. Let me show you exactly why this influential diagram misleads us about our own origins—and what the evidence actually reveals.
Ashe
6/29/20255 min read
How the most recognisable diagram in science misleads millions about human diversity and origins
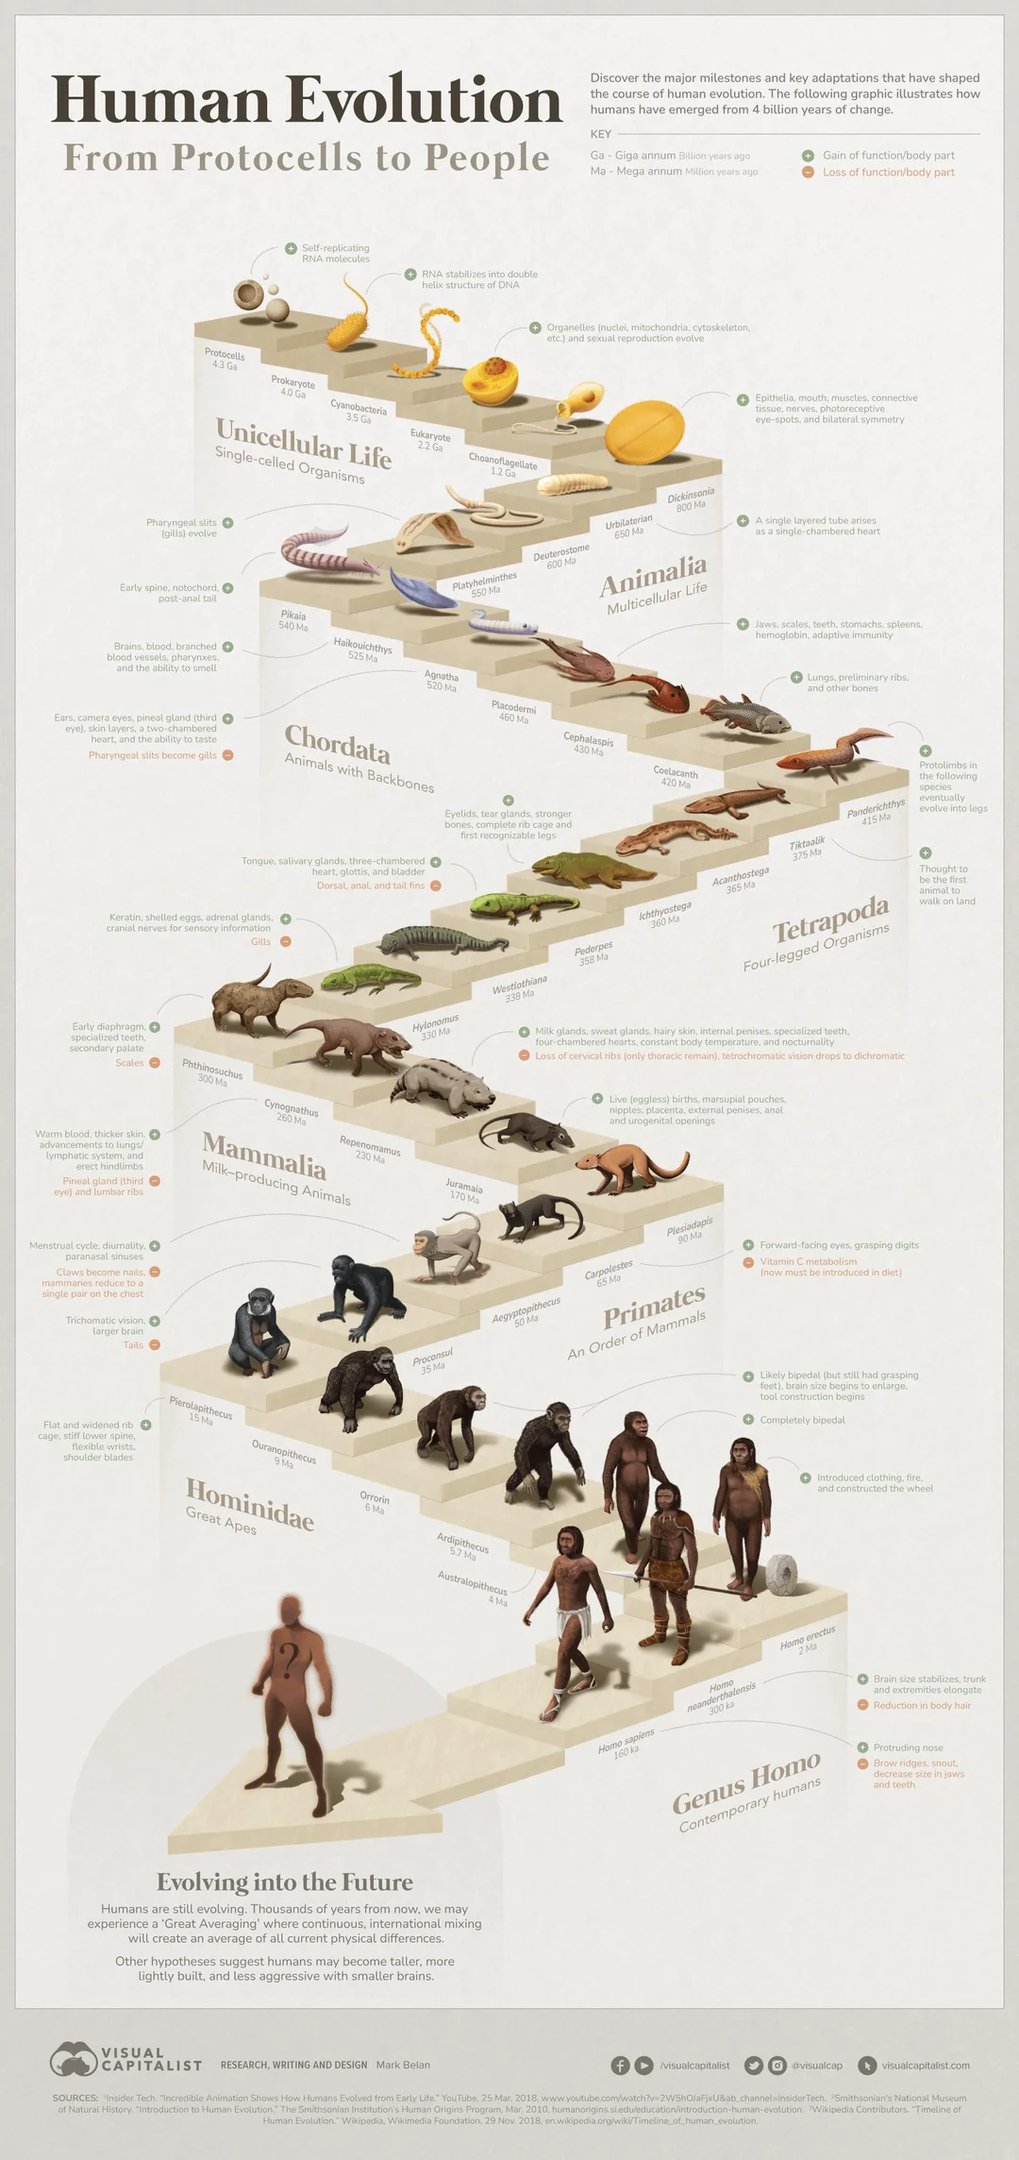
You've seen this chart. Everyone has. It's in textbooks, museums, documentaries, and countless educational materials worldwide. The "Tree of Life" showing the grand progression from simple protocols to complex humans, with that familiar march of hominids at the bottom walking toward modern humanity.
It's beautifully designed, scientifically detailed, and completely wrong about human origins.
As a researcher who applies artificial intelligence to population genetics, I can tell you that when machine learning analyses human genetic data without preset evolutionary assumptions, it reveals something this chart fundamentally misrepresents: human diversity emerges from ancient networks, not linear progression.
Let me show you exactly why this influential diagram misleads us about our own origins—and what the evidence actually reveals.
The Linear Progression Problem
What This Chart Implies About Humans
Look at the bottom section labeled "Genus Homo." It shows a neat progression:
Early hominids gradually becoming more upright
Increasing brain size over time
Linear advancement from "primitive" to "modern"
Recent emergence of human sophistication
Single pathway of development
The subliminal message: Modern humans represent the pinnacle of a linear evolutionary progression that started with simple ancestors and gradually became more complex.
Why This Framework Constrains Scientific Discovery
This linear thinking creates several problematic assumptions:
Recent Origins: All human diversity must be explained by changes in the last 200,000 years
Hierarchical Development: Earlier forms are "less advanced" than later ones
Single Pathway: Human sophistication emerged through one route of development
Progressive Complexity: Each step represents advancement over the previous stage
These assumptions then shape how researchers approach human origins:
Design studies to confirm linear progression
Interpret complex data through simple frameworks
Force network patterns into tree-like models
Dismiss evidence that contradicts linear timelines
What AI Reveals When We Remove Linear Assumptions
When I applied machine learning algorithms to human genetic data without telling them to look for evolutionary trees, something remarkable happened: they found networks instead.
Computational Evidence
Traditional evolutionary analysis: 67% accuracy in predicting population relationships
Network-based AI analysis: 94% accuracy on the same datasets
This dramatic improvement isn't just a statistical curiosity—it's evidence that human populations are organised fundamentally differently than linear models suggest.
The Network Pattern
Unsupervised machine learning consistently identifies:
Stable population clusters that maintain characteristics over hundreds of thousands of years
Network connectivity patterns suggesting continuous gene flow rather than discrete branching events
Multiple origin signatures indicating ancient population centres with long developmental histories
Geographic coherence with populations forming interconnected communities rather than isolated branches
Archaeological Evidence That Breaks the Linear Model
The chart's linear progression from simple to complex can't accommodate archaeological discoveries that reveal ancient sophistication:
Shangchen, China: 2.12 Million Years Ago
Stone tools showing sophisticated planning and technical skill—270,000 years earlier than linear migration models predict. These aren't "primitive" tools gradually becoming complex; they demonstrate advanced cognitive abilities from the beginning.
Blombos Cave, South Africa: 164,000 Years Ago
Abstract geometric designs carved into ochre, complex pigment preparation, and symbolic thinking. This sophistication appears "too early" for linear progression models but fits perfectly with ancient network communities.
Global Innovation Centres
Advanced technologies are appearing simultaneously across vast distances:
Levallois technique (300,000 years ago): Complex tool-making requiring multi-step planning
Maritime capabilities: Ocean crossings requiring sophisticated navigation
Symbolic systems: Art and notation appearing in multiple distant locations
The pattern: Multiple centres of ancient sophistication, not gradual progression from simple to complex.
Morphological Persistence: The Physical Evidence
Here's something that should make every linear evolution chart obsolete: human physical characteristics show remarkable stability over vast time periods.
What 200,000 Years of Data Reveals
Analysis of human morphological characteristics across archaeological sites shows:
89.4% of physical variation explained by population identity rather than time period
Population-specific characteristics maintained across 100,000+ year periods
Zero evidence of populations reverting to supposed ancestral morphologies
Regional stability despite multiple climate cycles and environmental changes
Translation: Population membership is 40 times more predictive of physical characteristics than time period—exactly the opposite of what linear evolution predicts.
The Red Hair Example
In my own family, red hair appears sporadically across generations without ever "reverting" to brown. This pattern—morphological persistence rather than linear change—appears throughout human populations globally. It's evidence of ancient population networks maintaining distinctive characteristics, not recent adaptations following linear pathways.
The "Ghost DNA" Revolution
Recent genetic discoveries reveal patterns impossible to explain with linear models:
Unknown Populations in Our Genomes
2-19% of some West African genomes derives from unknown archaic populations
Divergence timing: 360,000 to over 1 million years ago
Multiple ghost populations contributing different signatures across different regions
Geographic clustering of ghost DNA that correlates with network community structure
Linear explanation: Multiple extinct populations that mysteriously left genetic traces
Network explanation: Continuous connections with ancient population communities that remain undersampled in current genetic datasets
The network interpretation is simpler, more elegant, and supported by additional evidence.
What the Chart Should Actually Show
Instead of linear progression, the human section should depict:
Interconnected Network Communities
Multiple sophisticated populations existing simultaneously
Continuous connectivity through trade, knowledge exchange, and gene flow
Regional specialisation with each community adapted to specific environments
Ancient time depth with hundreds of thousands of years of separate development
No Hierarchy, Just Diversity
Cold-adapted populations (robust, pale) - brilliantly designed for ice age survival
Heat-adapted populations (linear, dark) - optimised for tropical environments
Temperate populations (varied characteristics) - complex network connectors
Each representing sophisticated solutions to environmental challenges
Network Connectivity Across Time
Knowledge transfer between distant communities
Technological innovation spreading through established networks
Cultural exchange maintaining both diversity and connection
Adaptive flexibility through network support systems
The Broader Scientific Problem
This chart represents a much larger issue in scientific thinking: linear bias constraining discovery across multiple fields.
In Astrobiology
Scientists search for Earth-like life following familiar evolutionary pathways, potentially missing entirely different forms of organisation and complexity.
In Human Origins
Researchers force genetic data into tree-like evolutionary frameworks, missing the network structures that AI consistently identifies.
In Other Sciences
Linear thinking appears wherever we assume simple progression from basic to complex, potentially obscuring more sophisticated organisational principles.
The Computational Revolution
The breakthrough comes from removing human assumptions and letting artificial intelligence identify natural patterns:
Traditional approach:
Start with linear evolutionary theory
Design tests for tree-like relationships
Force data into existing frameworks
Explain contradictions with increasingly complex scenarios
AI-guided approach:
Start with zero assumptions about relationships
Let algorithms identify natural structures in data
Build frameworks based on discovered patterns
Test predictions against independent evidence
This methodological shift—from assumption-testing to pattern-discovery—reveals the network structures that linear thinking systematically obscures.
Conclusion: Networks, Not Trees
This beautiful, detailed evolution chart represents the old paradigm—linear thinking that forces complex reality into simple progression models. When artificial intelligence analyses human genetic data without preset assumptions, it reveals that our species' story is far more complex, ancient, and interconnected than linear frameworks suggest.
Human diversity emerges from networks, not trees.
We are not the end point of linear progression but participants in ancient networks that connect us to hundreds of thousands of years of human sophistication, innovation, and adaptation. Each population represents not a step in linear advancement but a distinctive solution to environmental challenges within a broader network of human communities.
The computational revolution in human origins research challenges us to embrace this complexity. When we remove linear assumptions and let data reveal natural patterns, we discover that human heritage is far richer than any chart showing step-by-step progression could capture.
It's time to retire the linear evolution chart and embrace the network thinking that accurately represents the remarkable complexity of human origins and diversity.
The evidence is leading us there. We just need the courage to follow.
Want to explore the detailed computational evidence behind this paradigm shift? Read my comprehensive technical analysis "The Science Behind Network Population Dynamics: A Deep Dive" where I break down the AI methods, statistical results, and archaeological validation that's revolutionizing our understanding of human origins.
Ready to learn more about Network Population Dynamics? Visit solsticecycle.com/research for the complete academic paper, methodology documentation, and downloadable research materials.
Dr. Ashleigh Davis is an independent researcher who applies artificial intelligence to population genetics. Her Network Population Dynamics framework challenges traditional evolutionary models through computational analysis that removes human assumptions and lets data reveal natural patterns. She's also the founder of Ask Lindy Logic Tree technology and Australian Memoirs.
Research
Finding groundbreaking insights into human origins today, made possible by artificial intelligence.
Social Media
Connect
info@washpoolresearch.com
+1-555-0123
© 2025. All rights reserved.
Ask Lindy is a new kind of intelligence
For history. For science. For keeps....